What does this test do?
The dependent t-test (also called paired t-test or paired-samples t-test) compares the mean of two related groups to detect whether there are any statistically significant differences between these means.
What variables do we need for Dependent t-Test?
We need one dependent variable that is measured in an interval or ratio scale. We also need one categorical variable that has only two related groups.
What is meant by "related groups"?
A dependent t-test is an example of a "within-subjects" or "repeated-measures" statistical test. This indicates that the same subjects are tested more than once. Thus, in the dependent t-test, "related groups" indicates that the same subjects are present in both groups. The reason that it is possible to have the same subjects in each group is because each subject has been measured on two occasions on the same dependent variable.
For example, you might have measured 10 individuals' (subjects') performance in a spelling test (the dependent variable) before and after they underwent a new form of computerized teaching method to improve spelling. You would like to know if the computer training improved their spelling performance. Here, we can use a dependent t-test because we have two related groups. The first related group consists of the subjects at the beginning (prior to) the computerized spell training and the second related group consists of the same subjects, but now at the end of the computerized training
Does the dependent t-test test for "Changes" or "Differences" between related groups?
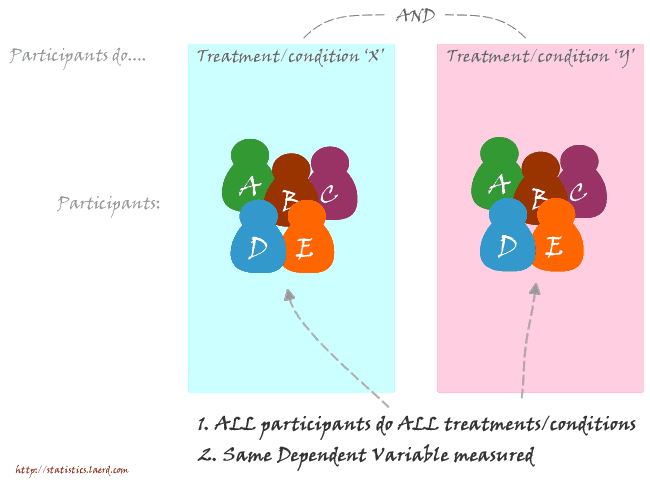
The dependent t-test can be used to test either a "change" or a "difference" in means between two related groups, but not both at the same time. Whether you are measuring a "change" or "difference" between the means of the two related groups depends on your study design. The two types of study design are indicated in the following diagrams.
How do you detect differences between experimental conditions using the dependent t-test?
The dependent t-test can look for "differences" between means when subjects are measured on the same dependent variable under two different conditions. For example, you might have tested subjects' eyesight (dependent variable) when wearing two different types of spectacle (independent variable). See the diagram below for a general schematic of this design approach
How do you detect changes in time using the dependent t-test?
The dependent t-test can also look for "changes" between means when the subjects are measured on the same dependent variable, but at two time points. A common use of this is in a pre-post study design. In this type of experiment, we measure subjects at the beginning and at the end of some intervention (e.g., an exercise-training programme or business-skills course). A general schematic is provided below

How do you detect differences between experimental conditions using the dependent t-test?
You can also use the dependent t-test to study more complex study designs although it is not normally recommended. The most common, more complex study design where you might use the dependent t-test is where you have a crossover design with two different interventions that are both performed by the same subjects. One example of this design is where you have one of the interventions act as a control. For example, you might want to investigate whether a course of diet counselling can help people lose weight. To study this you could simply measure subjects' weight before and after the diet counselling course for any changes in weight using a dependent t-test. However, to improve the study design you also include want to include a control trial. During this control trial, the subjects could either receive "normal" counselling or do nothing at all, or something else you deem appropriate. In order to assess this study using a dependent t-test, you would use the same subjects for the control trial as the diet counselling trial. You then measure the differences between the interventions at the end, and only at the end, of the two interventions. Remember, however, that this is unlikely to be the preferred statistical analysis for this study design.
What are the assumptions of the dependent t-test?
What hypothesis is being tested?
The dependent t-test is testing the null hypothesis that there are no differences between the means of the two related groups. If we get a significant result, we can reject the null hypothesis that there are no significant differences between the means and accept the alternative hypothesis that there are statistically significant differences between the means. We can express this as follows:
What is the advantage of dependent t-test over independent t-test?
Before we answer this question, we need to point out that you cannot choose one test over the other unless your study design allows it. What we are discussing here is whether it is advantageous to design a study that uses one set of subjects whom are measured twice or two separate groups of subjects measured once each. The major advantage of choosing a repeated-measures design (and therefore, running a dependent t-test) is that you get to eliminate the individual differences that occur between subjects - the concept that no two people are the same - and this increases the power of the test. What this means is that if you are more likely to detect any significant differences, if they do exist, using the dependent t-test versus the independent t-test.
Can the dependent t-test used to compare different subjects?
Yes, but this does not happen very often. You can use the dependent t-test instead of using the usual independent t-test when each subject in one of the independent groups is closely related to another subject in the other group on many individual characteristics. This approach is called a "matched-pairs" design. The reason we might want to do this is that the major advantage of running a within-subject (repeated-measures) design is that you get to eliminate between-groups variation from the equation (each individual is unique and will react slightly differently than someone else), thereby increasing the power of the test. Hence, the reason why we use the same subjects - we expect them to react in the same way as they are, after all, the same person. The most obvious case of when a "matched-pairs" design might be implemented is when using identical twins. Effectively you are choosing parameters to match your subjects on which you believe will result in each pair of subjects reacting in a similar way.
Here is the formula for a paired t-test.

The top of the formula is the sum of the differences (i.e. the sum of d). The bottom of the formula reads as:
The square root of the following: n times the sum of the differences squared minus the sum of the squared differences, all over n-1.
How do I report the result of a dependent t-test?
You need to report the test as follows:
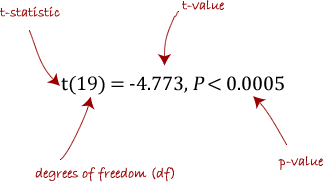 where df is N - 1, where N = number of subjects
Here is a example of Paired t-Test
Consider the data from a paper by Raskin and Unger (1978) where four diabetic patients were used to compare the effects of insulin infusion regimens. One treatment was insulin and somatostatin (IS) and the other treatment was insulin, somatostatin and gulcagon (ISG). Each subject was given each treatment with a period of washout between treatments. The data follow:
https://statistics.laerd.com/statistical-guides/dependent-t-test-statistical-guide.php
The dependent t-test (also called paired t-test or paired-samples t-test) compares the mean of two related groups to detect whether there are any statistically significant differences between these means.
What variables do we need for Dependent t-Test?
We need one dependent variable that is measured in an interval or ratio scale. We also need one categorical variable that has only two related groups.
Dependent Samples: When data are collected twice on the same subjects (or matched subjects) the proper analysis is a paired t-test (also called a dependent samples t-test). In this case, subjects may be measured in a before – after fashion, or in a design where a treatment is administered for a time, there is a washout period, and another treatment is administered (in random order for each subject). Or, data might be measured on the same individual in two areas such as one treatment in one eye and another treatment for another eye (or leg, or arm, etc). In these cases the measurement of interest is the difference between the first and second measure. Thus, the null hypothesis (two-sided) is:
Ho: mdifference = 0 (The average difference is 0)
Ha: mdifference ≠ 0 (The average difference is not 0)
What is meant by "related groups"?
A dependent t-test is an example of a "within-subjects" or "repeated-measures" statistical test. This indicates that the same subjects are tested more than once. Thus, in the dependent t-test, "related groups" indicates that the same subjects are present in both groups. The reason that it is possible to have the same subjects in each group is because each subject has been measured on two occasions on the same dependent variable.
For example, you might have measured 10 individuals' (subjects') performance in a spelling test (the dependent variable) before and after they underwent a new form of computerized teaching method to improve spelling. You would like to know if the computer training improved their spelling performance. Here, we can use a dependent t-test because we have two related groups. The first related group consists of the subjects at the beginning (prior to) the computerized spell training and the second related group consists of the same subjects, but now at the end of the computerized training
Does the dependent t-test test for "Changes" or "Differences" between related groups?
The dependent t-test can be used to test either a "change" or a "difference" in means between two related groups, but not both at the same time. Whether you are measuring a "change" or "difference" between the means of the two related groups depends on your study design. The two types of study design are indicated in the following diagrams.
How do you detect differences between experimental conditions using the dependent t-test?
The dependent t-test can look for "differences" between means when subjects are measured on the same dependent variable under two different conditions. For example, you might have tested subjects' eyesight (dependent variable) when wearing two different types of spectacle (independent variable). See the diagram below for a general schematic of this design approach
How do you detect changes in time using the dependent t-test?
The dependent t-test can also look for "changes" between means when the subjects are measured on the same dependent variable, but at two time points. A common use of this is in a pre-post study design. In this type of experiment, we measure subjects at the beginning and at the end of some intervention (e.g., an exercise-training programme or business-skills course). A general schematic is provided below
How do you detect differences between experimental conditions using the dependent t-test?
You can also use the dependent t-test to study more complex study designs although it is not normally recommended. The most common, more complex study design where you might use the dependent t-test is where you have a crossover design with two different interventions that are both performed by the same subjects. One example of this design is where you have one of the interventions act as a control. For example, you might want to investigate whether a course of diet counselling can help people lose weight. To study this you could simply measure subjects' weight before and after the diet counselling course for any changes in weight using a dependent t-test. However, to improve the study design you also include want to include a control trial. During this control trial, the subjects could either receive "normal" counselling or do nothing at all, or something else you deem appropriate. In order to assess this study using a dependent t-test, you would use the same subjects for the control trial as the diet counselling trial. You then measure the differences between the interventions at the end, and only at the end, of the two interventions. Remember, however, that this is unlikely to be the preferred statistical analysis for this study design.
What are the assumptions of the dependent t-test?
- The types of variables
- The distribution of the differences between the scores of the two related groups needs to be normally distributed - We do this by simply subtracting each individuals' score in one group from their score in the other related group and then testing for normality in the normal way It is important to note that the two related groups do not need to be normally distributed themselves - just the differences between the groups.
What hypothesis is being tested?
The dependent t-test is testing the null hypothesis that there are no differences between the means of the two related groups. If we get a significant result, we can reject the null hypothesis that there are no significant differences between the means and accept the alternative hypothesis that there are statistically significant differences between the means. We can express this as follows:
H0: µ1 = µ2
HA: µ1 ≠ µ2
What is the advantage of dependent t-test over independent t-test?
Before we answer this question, we need to point out that you cannot choose one test over the other unless your study design allows it. What we are discussing here is whether it is advantageous to design a study that uses one set of subjects whom are measured twice or two separate groups of subjects measured once each. The major advantage of choosing a repeated-measures design (and therefore, running a dependent t-test) is that you get to eliminate the individual differences that occur between subjects - the concept that no two people are the same - and this increases the power of the test. What this means is that if you are more likely to detect any significant differences, if they do exist, using the dependent t-test versus the independent t-test.
Can the dependent t-test used to compare different subjects?
Yes, but this does not happen very often. You can use the dependent t-test instead of using the usual independent t-test when each subject in one of the independent groups is closely related to another subject in the other group on many individual characteristics. This approach is called a "matched-pairs" design. The reason we might want to do this is that the major advantage of running a within-subject (repeated-measures) design is that you get to eliminate between-groups variation from the equation (each individual is unique and will react slightly differently than someone else), thereby increasing the power of the test. Hence, the reason why we use the same subjects - we expect them to react in the same way as they are, after all, the same person. The most obvious case of when a "matched-pairs" design might be implemented is when using identical twins. Effectively you are choosing parameters to match your subjects on which you believe will result in each pair of subjects reacting in a similar way.
Here is the formula for a paired t-test.
The top of the formula is the sum of the differences (i.e. the sum of d). The bottom of the formula reads as:
The square root of the following: n times the sum of the differences squared minus the sum of the squared differences, all over n-1.
- The sum of the squared differences: ∑d2 means take each difference in turn, square it, and add up all those squared numbers.
- The sum of the differences squared: (∑d)2means add up all the differences and square the result.
How do I report the result of a dependent t-test?
You need to report the test as follows:
Here is a example of Paired t-Test
Consider the data from a paper by Raskin and Unger (1978) where four diabetic patients were used to compare the effects of insulin infusion regimens. One treatment was insulin and somatostatin (IS) and the other treatment was insulin, somatostatin and gulcagon (ISG). Each subject was given each treatment with a period of washout between treatments. The data follow:
Patient
|
Treatment
| ||
Number
|
IS
|
ISG
|
Difference
|
1
|
14
|
17
|
3
|
2
|
6
|
8
|
2
|
3
|
7
|
11
|
4
|
4
|
6
|
9
|
3
|
Mean
|
8.25
|
11.25
|
3.0
|
S.E.M.
|
1.9
|
2
|
.40
|
A paper by Thomas Louis (1984) looked at this data using both types of t-tests (Dependent and Independent t-Test). The correct version of the t-test to use for this data set is the paired t-test since each patient is observed twice
Paired t-test analysis: The calculations for this test can be performed using the following SAS code:
data diabetic;
input IS ISG;
datalines;
14 17
6 8
7 11
6 9
ODS HTML;
PROC TTEST;
PAIRED IS*ISG;
RUN;
ODS HTML CLOSE;
The (partial) output is as follows. Note that the analysis is performed on the mean of the differences (-4.299) and that the standard error of the difference is 0.41
Difference
|
N
|
Lower CL
Mean |
Mean
|
Upper CL
Mean |
Lower CL
Std Dev |
Std Dev
|
Upper CL
Std Dev |
Std Err
|
IS - ISG
|
4
|
-4.299
|
-3
|
-1.701
|
0.4625
|
0.8165
|
3.0443
|
0.4082
|
The paired t-test yields p=0.005, which is statistically significant.
T-Tests
| |||
Difference
|
DF
|
t Value
|
Pr > |t|
|
IS - ISG
|
3
|
-7.35
|
0.0052
|
The reason that the paired t-test found significance when the independent t-test on the same data did not achieve significance is because the paired analysis is the more correct analysis and therefore it is able to make use of a much smaller standard error (of the mean difference rather than pooled.)
In his paper, Louis explains that to achieve the power of this paired t-test, an independent group t-test (parallel test) would require 14 times as many subjects. Thus, when the model is appropriate, the paired t-test can be a more powerful design to analysis your data. On the other hand, if you use a paired analysis on independent group data you will get incorrect and misleading results. Therefore, carefully consider how your experiment is designed before you select which t-test to perform.
References:
No comments:
Post a Comment